This is a research that I wrote for Scientific Research Methods exam on MBA study on International Burch University.
Abstract
This research looks into the relationship between the area of national parks (percentage of total area of a country) and happiness levels as measured by the World Happiness Index. The trend is analysed for the latest available year, 2024. The research builds on the notions of access to green spaces as a factor influencing happiness and wellbeing of people. The paper explores if any relationship can be established using Pearson correlation coefficient and finds that there is not a correlation between the two variables. Some countries are further explored in their own contexts of national parks and level of happiness including Costa Rica, Zambia and Scandinavian countries.
Keywords: National park, World Happiness, access to green spaces, wellbeing
- Introduction and Literature Review
1.1 Concept of Happiness in Economics
The analysis of happiness and wellbeing comes in both local and (inter)national settings. To start understanding happiness as a factor in consumer choices we need to refer to Easterlin’s work on economic growth and improved conditions (1974). The Easterlin Paradox finds that higher GDP or income does not correlate with higher levels of happiness. Easterlin’s work opened academic discussions on matters of happiness and well-being as more nuanced than only correlated with income.
Environmental aspects were then also considered in the further studies. The rationale for inclusion of the environmental aspects can be found in Wilson’s work (1984, 2021) and the theory of biophilia, that humans strive to be close to nature and also feeling positive.
Another rationale stemming from a psychological perspective would be an Attention Restoration Theory by Rachel and Stephen Kaplan (1989), that presented fascination with nature though different communities. Lastly, promotion of physical activities is listed as a benefit.
An additional shift away from GDP as the measure of happiness was promoted by the Kingdom of Bhutan with their Gross National Happiness. The Centre for Bhutan Studies published an explanation of GNH (Wangdi et al, 2012). The GNH Index provides an overview of performance across 9 domains of GNH (psychological wellbeing, time use, community vitality, cultural diversity, ecological resilience, living standard, health, education, good governance. GNH is conducted on a national level and tries to separate the notions of productivity as the only measure of happiness and wellbeing. The reason for the World Happiness Index initiation by the UN was because of Bhutan’s initiative to include happiness as the measure of holistic development (The World Happiness Report, n.d.).
The World Happiness Report includes self-reporting on the following factors: social support, GDP per capita, healthy life expectancy, freedom, generosity and perceptions of corruption. There are also perceptions of positive and negative feelings, however explanatory factors comprise the most of the index. The World Happiness Report is a robust and comprehensive index.
1.2 City-level happiness and green spaces
Various socioeconomic factors were explored in relation to happiness. Brereton et al. (2008) look at the role of the environment in the levels of happiness and subjective well-being. They combine Geographic Information Systems to analyze local environments and their features like proximity to waste management, access to green spaces, transportation, etc. Visual computation aims to explore the relationship of happiness with a local context and access to resources.
In later years Larson and Cloutier (2016) compared the access to city parks and well-being for the context of the United States, they found that the park quantity, a percentage of city area covered by public parks, was among the strongest predictors of overall wellbeing.
An example of connection between happiness and green space is done by Kwon at al. (2021) They chose 90 global cities through their green coverage and correlated them with a nation’s happiness level. GDP is also taken into correlation with happiness. They found 60 countries of higher GDP have a higher correlation of urban green space and Happiness Index. They used the World Happiness Index.
As mentioned a number of journals equate GDP per capita PPP of a country with the city, which might not be always accurate. In some examples cities, particularly capital cities will have significantly higher GDP per capita, an example would be Paris and its region Ile-de-France which had over 120,000 GDP per worker in USD PPP and the country’s average for the same year was around 90,000 (OECD, 2019). Hence there could be a mismatch for applying nation’s numbers to the city level.
Measuring happiness and wellbeing in the same way it is conducted through national-level surveys was done by the Institute for Quality of Life “Happy City Index”. Through 6 themes they explore levels of happiness (health, mobility, economy, environment, governance and citizens; their activities, level of education, jobs, etc) Happy City Index operates for two years, their data shows only the ranking of 31 first cities, referred to as gold cities. If such an index becomes more comprehensive and available it could serve as an indicator of the local level, rather than nationally applied to the scale of urban areas.
In the Sustainable Development Goals, the indicator 11.7.1 measures an average share of the build-up space for public use for all, by sex, age and persons with disabilities. This is a part of the series for the average share of urban population with convenient access to open public spaces. Data can be found on the UN Stats website, available urban green space means that people have access to it within a kilometer or kilometer and a half. Non-GDP values listed are social values, like stress reduction, improvement of social capital, the immune system, physical activity, reduction of urban heat island effect. (UN Stats, 2018,4)
One country’s in-depth exploration has been covered by Cheng, M. (2020) where they explored Chinese urban settings and residents’ happiness levels. This involved the survey responses from the Chinese National Bureau of Statistics that uses a likert scale of sorts, asking about happiness from ‘Extremely’, ‘Very Happy’, etc. The results show income levels determine positive or negative relationships, where “greenness per capita” has a negative effect on happiness of urban residents with lower income levels and the relationship turns positive with higher income. This particular case might not be applicable to other cities, however, it shows the interplay of happiness and income levels.
Looking at the relationship between the World Happiness Index for countries with the highest Human Development Index and comparing it with the urban green areas. Authors use satellite images, specifically Normalized Difference Vegetation Index for cities and Pearson’s and Spearman’s correlation coefficients. The claim here is that cities are a good representation of countries.
In the space between city level and national level Saw et al. explore Singapore and the relationship between well-being and the access to different green spaces (2015). They find that although the access might be relatively high, the climate marked with high temperature and humidity plays a significant role in the use of those green spaces, hence the wellbeing does not necessarily correlate in this case.
1.3 National-level happiness and green spaces
Exploring the national aspect of happiness and environmental factors, we can look into Atiquil Haq’s analysis of benefits of national parks for developing countries (2016). It is stated they are sources of economic benefit to the local population. National parks tend to improve livelihood and serve as a part of the climate change mitigation strategies. This journal provides a breakdown of environmental movements and extrapolates scope of national parks, the definition used for the research.
National Park definitions used by the IUCN stemmed from the need to unify what is meant by the term. National Park is then a relatively large area with ecosystem(s), without exploitation or occupation of the whole area and where visitors are allowed to enter. (definition of national park, 1969). Using an approach by Kwon et al and applying it to the national context in combination with Atiquil Haq’s breakdown of benefits of the national parks, this research will look at the relationship between national parks and World Happiness Index for the latest year, 2024.
As indicated above, the World Happiness Index is the most comprehensive from various Happiness indices, it is available for the largest number of countries. Additionally, understanding the importance of green spaces, this research will look into national parks/protected areas in relation to happiness to see if the efforts to preserve and protect areas have a direct impact on the level of happiness. Happiness measures take many variables into account, however, this research will try to single out one environmental aspect.
Research question: “What is the relationship between National park area – percentage of the total area (%) and the World Happiness Index for countries globally in 2024?
As the goal of the research is to see if there are any general patterns for these two variables, it will try to include as many countries as possible. It is not expected that even if there is some correlation it would indicate any causation among the two variables, but rather to explore a possibility of analyzing area coverage to happiness/wellbeing.
- Methodology
Table 1
Variables
| Variables | ||
| Independent | National park area – percentage of the total area (%) | World Population Review |
| Dependent | World Happiness Index | WHI taken from the year 2024. |
| Controlled | Year choice – 2024 | Latest available year with data to show the most recent trend. |
| Uncontrolled | Unavailability of data for some countries | Both data sets will be cross-referenced which will reduce the number of countries. |
- Data for the National Parks area as a percentage of total area for the year 2024 is downloaded from the World Population Review.
- Data for the World Happiness Index is downloaded from GitHub
- Data for the WHI is then selected for 2024 year only.
- Using XLOOKUP function two lists were merged where the key finding term was a country name
- “Not found” countries that are not matched are removed from the list
- Data can be shown with and without outliers
- Trendlines and correlation coefficients are calculated through Sheets using function =PEARSON(C2:C84,B2:B84)
- Look for the Interquartile Range and determine any outliers for the national park areas.
2.1 Data presentation
Image 1
National Parks by Country
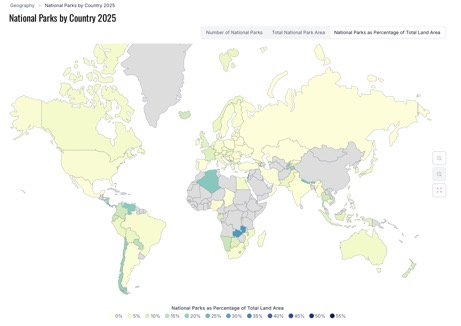
The map above shows the data set that is used for this research, it is compiled by the World Population Review. Countries with higher area coverage are in darker hues can be noticed. There is not an evident pattern that we can establish, such as a region. Countries in gray have their data unavailable which will reduce the number of countries significantly.
Image 2
World Happiness Report 2024 (WHR, n.d.)
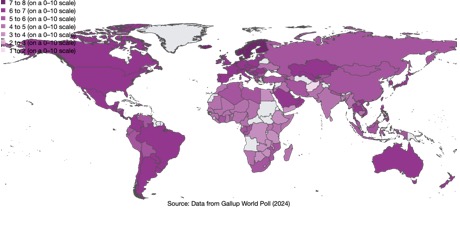
This image shows the World Happiness Report for 2024 with the darkest shades of purple being the highest level of happiness reported. Relatively high levels of happiness can be found in the Americas, Europe, South East Asia with additional countries.
Table 2
List of countries and their National Parks percentage and World Happiness Index in 2024
| Country | National Parks as Percentage of Total Area % | World Happiness Index | Country | National Parks as Percentage of Total Area % | World Happiness Index |
| Switzerland | 0.4 | 7.06 | Cambodia | 4.1 | 4.341 |
| Philippines | 0.6 | 6.048 | Slovenia | 4.1 | 6.743 |
| Malta | 0.69 | 6.346 | Egypt | 4.3 | 3.977 |
| Kazakhstan | 0.7 | 6.188 | Australia | 4.36 | 7.057 |
| Mexico | 0.73 | 6.678 | Italy | 5 | 6.324 |
| Spain | 0.8 | 6.421 | Mozambique | 5.1 | 5.216 |
| Portugal | 0.8 | 6.03 | Hungary | 5.2 | 6.017 |
| Russia | 0.82 | 5.785 | Estonia | 5.2 | 6.448 |
| Ireland | 0.9 | 6.838 | Japan | 5.4 | 6.06 |
| Bosnia and Herzegovina | 0.9 | 5.877 | Denmark | 5.4 | 7.583 |
| Poland | 1 | 6.442 | Bolivia | 6 | 5.784 |
| Moldova | 1 | 5.816 | Peru | 6.2 | 5.841 |
| Chad | 1.13 | 4.471 | Norway | 6.3 | 7.302 |
| India | 1.16 | 4.054 | Pakistan | 6.63 | 4.657 |
| Ukraine | 1.2 | 4.873 | South Korea | 6.7 | 6.058 |
| Iran | 1.2 | 4.923 | Albania | 6.7 | 5.304 |
| Romania | 1.3 | 6.491 | Georgia | 7 | 5.185 |
| Argentina | 1.38 | 6.188 | Slovakia | 7.5 | 6.257 |
| Myanmar | 1.5 | 4.354 | Montenegro | 7.9 | 5.707 |
| Gambia | 1.5 | 4.485 | United Kingdom | 8.2 | 6.749 |
| Sweden | 1.6 | 7.344 | Indonesia | 8.43 | 5.568 |
| Eswatini | 1.74 | 3.502 | France | 9.5 | 6.609 |
| Croatia | 1.8 | 5.942 | Botswana | 9.67 | 3.383 |
| Bulgaria | 1.8 | 5.463 | Gabon | 10 | 5.106 |
| Belgium | 2.1 | 6.894 | New Zealand | 10.8 | 7.029 |
| United States | 2.19 | 6.725 | Thailand | 11.96 | 5.976 |
| Serbia | 2.19 | 6.411 | Iceland | 12.1 | 7.525 |
| Madagascar | 2.4 | 4.228 | Ecuador | 12.2 | 5.725 |
| Lithuania | 2.4 | 6.818 | Colombia | 12.5 | 5.695 |
| Germany | 2.7 | 6.719 | Namibia | 13.2 | 4.832 |
| Finland | 2.9 | 7.741 | Paraguay | 14.9 | 5.977 |
| Brazil | 2.968 | 6.272 | Panama | 16.57 | 6.358 |
| South Africa | 3 | 5.422 | Nicaragua | 17.3 | 6.284 |
| Netherlands | 3 | 7.319 | Tajikistan | 18 | 5.281 |
| Nigeria | 3 | 4.881 | Chile | 19.3 | 6.36 |
| Austria | 3 | 6.905 | Venezuela | 21.76 | 5.607 |
| Latvia | 3.2 | 6.234 | Algeria | 22.1 | 5.364 |
| Mauritius | 3.5 | 5.816 | Nepal | 23.39 | 5.158 |
| Greece | 3.6 | 5.934 | Costa Rica | 25.1 | 6.955 |
| Kyrgyzstan | 3.625 | 5.714 | Israel | 30 | 7.341 |
| Canada | 3.78 | 6.9 | Zambia | 32 | 3.502 |
| N. Macedonia | 3.8 | 5.369 | Comoros | 52.16 | 3.566 |
3. Data Analysis and Results
Figure 1
World Happiness Index vs. National Parks (84 countries)
Comoros leads with the highest protected area. Comoros is an island nation with many marine and terrestrial protected areas. (Comoros, n.d.) Due to the small size of the area and a specific nature of islands where some parks might not have large populations, Comoros will be excluded from the data processing.
Figure 2
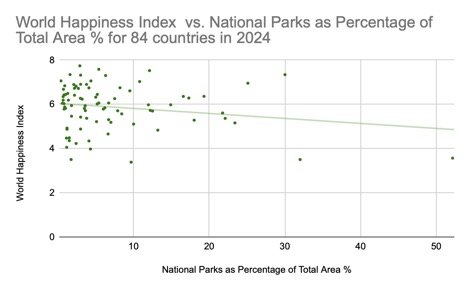
World Happiness Index vs. National Parks as Percentage of Total Area
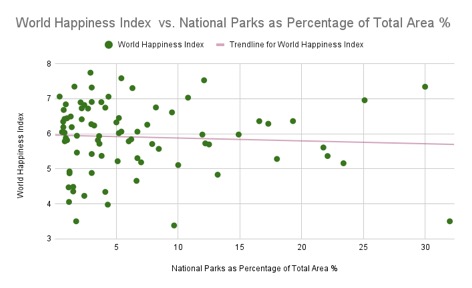
The scatterplot indicates a linear trendline, therefore in terms of correlation coefficient Pearson correlation coefficient can be used. Pearson Correlation Coefficient is used to determine the strength of a linear association. (Pearson correlation coefficient calculator, n.d.) Other correlation coefficients like Spearman would have been used if there was a curve. Nevertheless, Pearson would be sufficient in this case.
In Google Sheet Pearson can be calculated using the function =PEARSON, comparing the dependent variable to independent (=PEARSON(C2:C84,B2:B84)

The Correlation Coefficient is -0.05824668693, or -0.06 adjusted, it falls between 0 and 0.1 with no correlation at all.
The majority of national parks for the listed countries fall in the range of 0 to 10%, and in this range we see that we have a variety of values for the World Happiness Index. To further analyse the relationship between these two variables we can look into their distribution in quartiles and interquartile range.
Table 2
Interquartile range
| Lower bound | -8.2975 |
| Upper bound | 18.2825 |
The lower bound for the Inter-quartile range is a negative value, indicating an absence of low outliers. Upper bound on the other hand shows 18.28 which leaves a couple of countries outside of that range: Zambia (32%), Israel (30%), Costa Rica (25.1%), Nepal (23.39%), Algeria (22.1%), Venezuela (21.76%), Chile (19.3%).
WIth these outliers excluded from the Pearson Correlation Coefficient it is -0.01225199771, or -0.01 which is even lower than the value with the outliers included. We can conclude that the area of national parks adjusted as a percentage of the total country does not have an impact on the World Happiness Index as an indicator of happiness of the population. We can see that countries with a high percentage fall in a wide range of the index. Even though a number of countries does not have data on the national park area, it would not have altered the results significantly, since over 80 data points established a significant portion of the world’s countries. Perhaps a more fit approach would be to look at a couple of countries and explore further their set up of national parks and if there are any further connections to overall happiness/wellbeing.
4. Discussion
Figure 3
Graph of the World Happiness Index and National Parks with countries highlighted
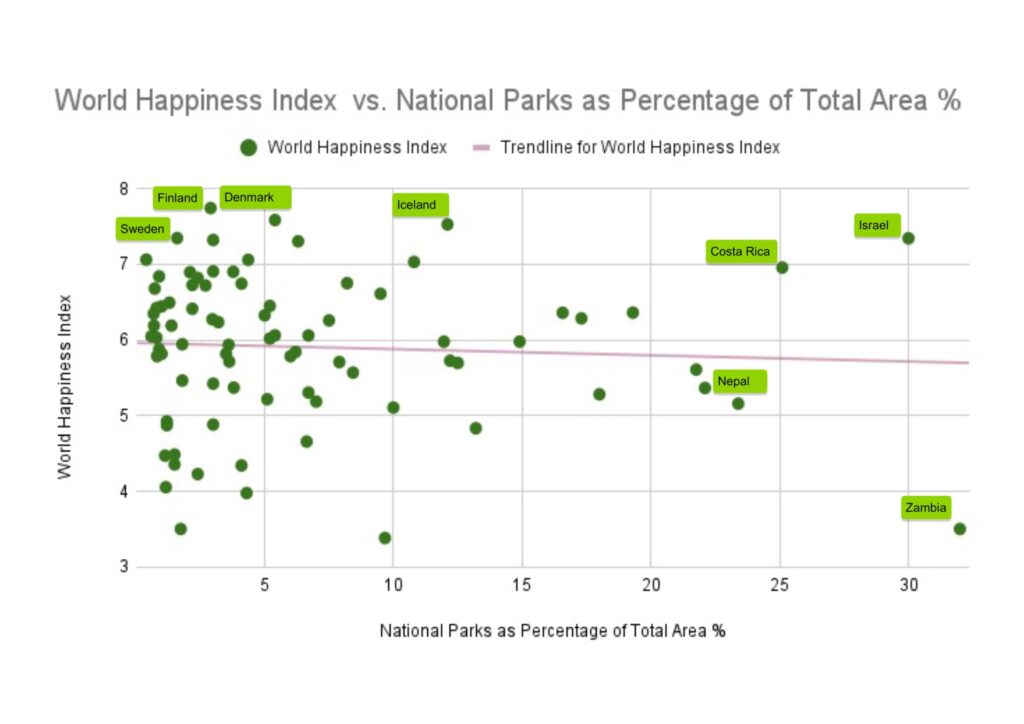
Countries with the highest national park areas are Zambia, Israel, Costa Rica and Nepal, whereas countries with highest WHI are Finland, Denmark, Iceland and Sweden respectively. The graph above outlines these countries, the next section explores how a couple of these countries from two different ends of the scale compare in terms of happiness and their set up of national parks.
4.1 Park Management and Tourism
Zambia has the highest national park percentage and one of the lowest WHI. The Zambian case shows that the size of a park does not indicate levels of happiness. An area of a park also does not indicate how well managed that area is. Lindsey et al compared several sub-Saharan countries and their financial management of national parks, and found that Zambia underperforms, and has lowest revenues. They also note that higher revenue comes from Game and hunting and there is mismanagement of resources. (2014) A large area of the park also means a larger space that is vulnerable to poaching, expanded settlements. The disconnect between national parks and a local community is also due to the limited number of jobs, small-scale operations, so the local community does not necessarily benefit from the park. (Lindsey et al., 2014)
On the other hand, Costa Rica has higher involvement of the local population as stakeholders in national parks. This country established the first national park in the 1950s and started expanding national parks in the 1970s and since then the majority of the tourism is based in some way to these national parks. (Boza, 1993; Costa Rica national parks, n.d.). An estimate for 2024 is that 68.8% of GDP is for services, which is mostly concerning tourism. (Costa Rica Factbook, n.d.). Costa Rica is a leader in ecotourism and a special case of targeted development towards a green economy. Happiness of the local population could in part be connected to national parks in terms of their job security and revenues from tourism. This is exactly the issue with Zambia and their mismanagement of the national parks. It could also imply that the connection of financial security and benefits from the parks have more weight than just an access to the parks. From both of these examples it can be argued that the local population is not necessarily the one in majority of the parks’ visitors, it is rather the visits from abroad.. Particular marketing practices are targeted towards the visitors and for Costa Rica those are visitors from the United States and Canada. (ICT, n.d) this further indicates a shortcoming of only looking at national parks in relation to happiness/wellbeing since its users are not the local population.
4.2 Allemansätt – Right to Roam
On the opposite end of the area coverage we have a few Scandinavian countries, as marked in the graph above. For example, Sweden established national parks in 1909, which served as a step towards building patriotism, as well as having scientific and aesthetic purposes.(Dahlberg et al, 2010) It was also agreed that the park should not infringe on private property or produce cost to the country, so the majority of them were in mountainous areas and ignored indigenous Sami communities in the set up. Later on more area was turned into national parks, however, access to green spaces is not limited by having only national parks. The concept of a ‘right to roam’ or Allemansättin Swedish is a system of private property being available to public access. (Campion & Stephenson, 2010). A right to roam exists in Finland, Iceland, Norway, whereas in Denmark this right is still existing, but is more restricted (Riis, 2021). The aforementioned countries are at the top of the World Happiness Index. National parks do not present the only green area to be accessed, rather the majority of private property is open for leisure activities like walking, hiking, camping. That leaves national parks as just one of the areas available for these activities, so national parks are not the only places where people can enjoy the outdoors. It means that these spaces are more integrated and connected to places where people live. In the case of Sweden, most of their national parks are in more remote areas, so visiting them for most people would require a special excursion and therefore a limited access.
5. Conclusion
Referring back to Kwon et al. from 2021l and their approach for green urban spaces and overall wellbeing of the people in cities, we can conclude that this cannot be applied to a national scale. Although national parks have the same definition, they are used for various purposes from hiking and camping to game and hunting, so their use is diverse.
In addition to having national parks as a representation of the protected space designed for public use among other purposes, it is needed to consider how these spaces are used, whether that’s for hiking/camping, game and hunting, or different purposes. Another factor would be whether the local population visits the parks to the same extent as visitors from abroad and to whom these parks are marketed. Quantification of the area of parks does not give an indication of their management, involvement of local population and if there are sustainable revenue flow.
Since management of parks and their purposes vary greatly across different parks and countries, further studies on this topic could step away from an analysis of a global trend and focus on several parks of interest. Involvement of the local population could be surveyed through their employment as well as their attitudes towards the protected areas through survey work.
6. Bibliography
#2025 happy city index #2025 HAPPY CITY INDEX. (n.d.). https://happy-city-index.com/Cities_2026/
Atiqul Haq, S. Md. (2016). Multi-benefits of National Parks and protected areas: An integrative approach for developing countries. Environmental & Socio-Economic Studies, 4(1), 1–11. https://doi.org/10.1515/environ-2016-0001
Boza, M. A. (1993). Conservation in action: Past, present, and future of the National Park System of Costa Rica*. Conservation Biology, 7(2), 239–247. https://doi.org/10.1046/j.1523-1739.1993.07020239.x
Brereton, F., Clinch, J. P., & Ferreira, S. (2008). Happiness, geography and the environment. Ecological Economics, 65(2), 386–396. https://doi.org/10.1016/j.ecolecon.2007.07.008
Campion, R., & Stephenson, J. (2010). The ‘right to roam’: Lessons for New Zealand from sweden’sallemansrätt. Australasian Journal of Environmental Management, 17(1), 18–26. https://doi.org/10.1080/14486563.2010.9725245
Central Intelligence Agency. (n.d.). Costa Rica Factbook. Central Intelligence Agency. https://www.cia.gov/the-world-factbook/countries/costa-rica/#economy
Cheng, M. (2020). Are people happier with larger green space? A study of greenness and happiness in urban China. Journal of Chinese Economic and Business Studies, 18(2), 183–201. https://doi.org/10.1080/14765284.2020.1798639
Costa Rica national parks: Global alliance of national parks. Costa Rica National Parks | Global Alliance of National Parks. (n.d.). https://national-parks.org/costa-rica
Dahlberg, A., Rohde, R., & Sandell, K. (2010). National Parks and Environmental Justice: Comparing access rights and ideological legacies in three countries. Conservation and Society, 8(3), 209. https://doi.org/10.4103/0972-4923.73810
Definition of national parks. IUCN. (n.d.). https://portals.iucn.org/library/sites/library/files/resrecfiles/GA_10_RES_001_Definition_of_National_Parks.pdf
Easterlin, R. A. (1974). Does economic growth improve the human lot? some empirical evidence. Nations and Households in Economic Growth, 89–125. https://doi.org/10.1016/b978-0-12-205050-3.50008-7
Happiness Index (Version 1). The Institute of Development Studies and Partner Organisations. https://hdl.handle.net/20.500.12413/11807
Hashemi , F., Behrouz, A., Yang, J., Wohn, D. Y., & Cha, M. (2020). Green space and happiness of developed countries. 2020 IEEE International Conference on Big Data and Smart Computing (BigComp), 247–250. https://doi.org/10.1109/bigcomp48618.2020.00-67
Helliwell, J. F., Layard, R., Sachs, J. D., De Neve, J.-E., Aknin, L. B., & Wang, S. (Eds.). (2025). World Happiness Report 2025. University of Oxford: Wellbeing Research Centre
Home | The World Happiness Report. (n.d.). https://www.worldhappiness.report/
Home – instituto costarricense de turismo. ICT. (n.d.). https://www.ict.go.cr/en/
Kaplan R, Kaplan S. The experience of nature: a psychological perspective. Cambridge; New York:Cambridge University Press; 1989
Kwon, O.-H., Hong, I., Yang, J., Wohn, D. Y., Jung, W.-S., & Cha, M. (2021). Urban green space and happiness in developed countries. EPJ Data Science, 10(1). https://doi.org/10.1140/epjds/s13688-021-00278-7
Larson, L. R., Jennings, V., & Cloutier, S. A. (2016). Public parks and wellbeing in urban areas of the United States. PLOS ONE, 11(4). https://doi.org/10.1371/journal.pone.0153211
Lindsey, P. A., Nyirenda, V. R., Barnes, J. I., Becker, M. S., McRobb, R., Tambling, C. J., Taylor, W. A., Watson, F. G., & t’Sas-Rolfes, M. (2014). Underperformance of african protected area networks and the case for new Conservation Models: Insights from Zambia. PLoS ONE, 9(5). https://doi.org/10.1371/journal.pone.0094109
Pearson correlation coefficient calculator. Social Science Statistics. (n.d.). https://www.socscistatistics.com/tests/pearson/default.aspx
Riis, M. (2021, August 5). Rights of way and accessing land. Wild About Denmark. https://wildaboutdenmark.com/rights-of-way-and-accessing-land/
Saw, L. E., Lim, F. K., & Carrasco, L. R. (2015). The relationship between Natural Park usage and happiness does not hold in a tropical city-state. PLOS ONE, 10(7). https://doi.org/10.1371/journal.pone.0133781
UNEP . (n.d.). Protected Area Profile for Comoros from the World Database on Protected Areas. Protected Planet. https://www.protectedplanet.net/country/COM
UN Habitat. (2018). Developing Public Space and Land Values in Cities and Neighbourhoods. UN Habitat. https://unhabitat.org/sites/default/files/download-manager-files/Discussion%20Paper%20-%20Developing%20Public%20Space%20and%20Land%20Values%20in%20Cities%20and%20Neighbourhoods.pdf
Wangdi, K., Ura, K., Alkire, S., & Zangmo, T. (2012). A Short Guide to Gross National
Wilson, E. O. (2021). Biophilia. Harvard University Press.
World Happiness Report (WHR) Measures life evaluations and contributing factors such as GDP, social support, and life expectancy. https://www.worldhappiness.report/data-sharing/ https://github.com/Escavine/World-Happiness/blob/main/World-happiness-report-2024.csv 2005–2024 Open data (CC BY 4.0) — UN Sustainable Development Solutions Network 2024
World Population Review. (2025, October 28). National parks by country 2025. https://worldpopulationreview.com/country-rankings/national-parks-by-country
Leave a Reply