CONFLICT RISK ASSESSMENT FOR BOSNIA AND HERZEGOVINA
Political Instability Task Force (PITF) Model Analysis
Analysis Date: February 5, 2026
Country: Bosnia and Herzegovina
Assessment Period: 2024-2026
Analyst: Conflict Prediction Study
Author: Vehid Džiho
EXECUTIVE SUMMARY
This analysis applies the Political Instability Task Force (PITF) model to assess the risk of armed conflict in Bosnia and Herzegovina. Based on verified data from V-Dem, World Bank, UCDP, and the 2013 census, Bosnia faces MODERATE TO ELEVATED conflict risk due to its status as an anocracy with declining democratic quality, ethnic dominance patterns, and high ethnic fractionalization. However, this risk is mitigated by high development levels, 30 years of peace, and absence of neighborhood conflicts. This analysis is done mostly from me and a help of AI – Claude. Thats why are some of the weird green checkmarks like I am some Politican who is willing to candidate on local elections and it is promising what he will do. Calculations mostly done with Python.
Key Findings:
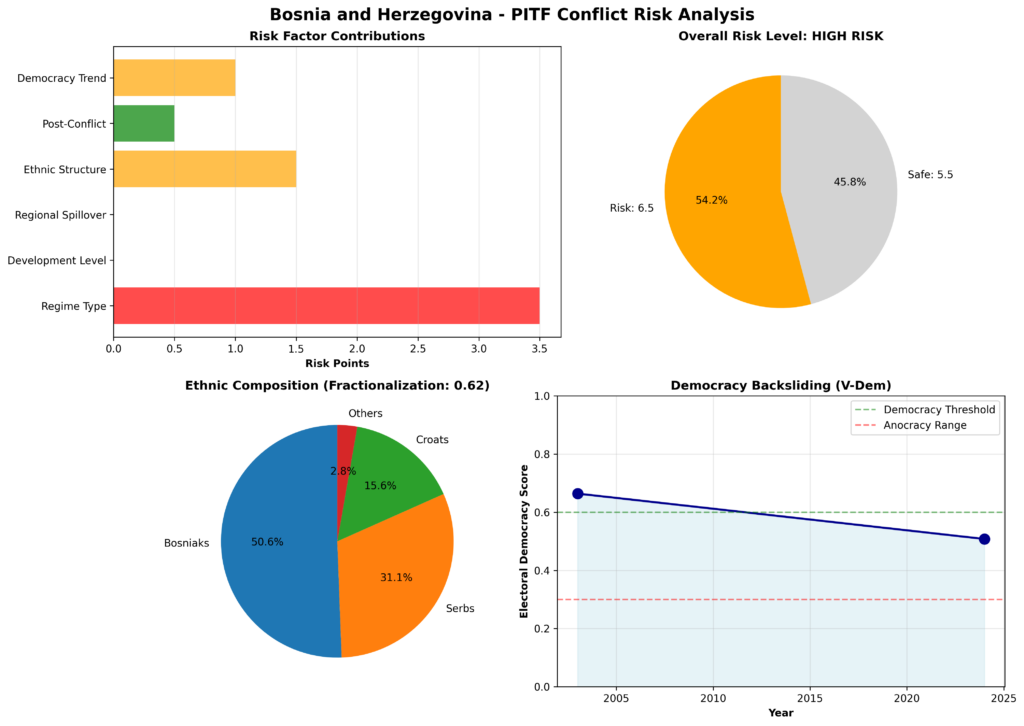
- Regime Type: Anocracy (Electoral Democracy: 0.508) – HIGH RISK CATEGORY
- Democratic Backsliding: 23% decline since 2003 peak – ELEVATED RISK
- Ethnic Structure: High fractionalization (0.62) + Ethnic dominance (50.11%) – RISK FACTOR
- Development: Low infant mortality (5.3) – PROTECTIVE FACTOR
- Regional Environment: No neighborhood conflicts – PROTECTIVE FACTOR
- Post-Conflict: 30 years since Dayton Agreement – PROTECTIVE FACTOR
Overall Risk Assessment: MODERATE (with caution regarding democratic backsliding trends)
1. INTRODUCTION
1.1 Background
Bosnia and Herzegovina (BiH) emerged from the Yugoslav Wars (1992-1995) as a complex, ethnically divided state governed by the Dayton Peace Agreement. The country’s unique constitutional structure, which divides power among three constituent peoples (Bosniaks, Serbs, and Croats) across two entities and ten cantons, creates inherent governance challenges. Thirty years after Dayton, questions about Bosnia’s stability and conflict risk remain relevant, particularly given recent democratic backsliding and renewed secessionist rhetoric.
1.2 Research Question
What is the current risk of armed conflict onset in Bosnia and Herzegovina?
1.3 Methodology
This analysis employs the Political Instability Task Force (PITF) model, one of the most widely validated frameworks for predicting civil conflict. The PITF model identifies four key risk factors:
- Regime Type (particularly anocracies/partial democracies)
- Infant Mortality (proxy for economic development and state capacity)
- Ethnic Discrimination (state-sponsored discrimination against minorities)
- Neighborhood Conflicts (regional conflict diffusion)
We supplement the PITF framework with additional variables from Collier-Hoeffler and Fearon-Laitin models, including:
- Ethnic fractionalization
- Democratic trends (backsliding indicators)
- Post-conflict duration
- State capacity measures
1.4 Data Sources
All data are verified from authoritative sources:
- Regime Data: V-Dem Institute Dataset v15 (2024)
- Economic Data: World Bank Development Indicators (2023)
- Conflict Data: Uppsala Conflict Data Program (UCDP) (2024)
- Ethnic Data: Bosnia and Herzegovina 2013 Census
- Fractionalization: Calculated from census data, validated against Alesina et al. (2003)
2. PITF MODEL VARIABLES – BOSNIA AND HERZEGOVINA
2.1 Regime Type (CRITICAL VARIABLE)
Value: Electoral Democracy = 0.508 (V-Dem 2024)
Category: ANOCRACY (Partial Democracy)
Risk Level: ⚠️ HIGH RISK
Analysis:
Bosnia’s regime type is the single most important risk factor in the PITF model. With an electoral democracy score of 0.508, Bosnia falls squarely in the anocracy range (0.3 – 0.6), which research consistently identifies as the highest-risk category for civil conflict.
What is an Anocracy? An anocracy is a hybrid regime that combines democratic and authoritarian features. These regimes are unstable because:
- Institutions are weak enough to be challenged
- But strong enough to provoke violent resistance
- Political competition exists but is not fully regulated
- Power-sharing mechanisms are contested
Bosnia’s Anocratic Features:
- Electoral competition exists but is dominated by ethnic nationalist parties
- Power-sharing is institutionalized but frequently gridlocked
- Weak central government with limited authority over entities
- Contested legitimacy of international oversight (High Representative)
- Ethnic veto powers enable institutional paralysis
PITF Research Finding: Anocracies experience civil war onset at 5 times the rate of democracies and 3 times the rate of autocracies. The instability stems from:
- Partial openness creates opportunities for mobilization
- Weak institutions cannot regulate competition
- Power-sharing creates winners who seek more
- Losers have incentive and capacity to rebel
Additional Regime Indicators (V-Dem 2024):
- Liberal Democracy: 0.342 (weak checks on power)
- Participatory Democracy: 0.302 (limited citizen participation)
- Rule of Law: 0.432 (moderate but weak)
- Civil Liberties: 0.811 (relatively strong – protective factor)
Conclusion: Bosnia’s anocratic regime type places it in the highest-risk category for conflict onset according to PITF research.
2.2 Democratic Backsliding (CRITICAL TREND)
Peak: Electoral Democracy = 0.664 (2003)
Current: Electoral Democracy = 0.508 (2024)
Decline: -23.5% over 21 years
Risk Level: ⚠️ ELEVATED RISK
Analysis:
Bosnia is not only an anocracy but a declining anocracy, which significantly increases conflict risk. Recent research shows that democratic backsliding is among the strongest predictors of civil conflict.
Backsliding Timeline:
- 1996-2003: Post-Dayton consolidation, democracy improves (0.268 → 0.664)
- 2003-2007: Peak democracy maintained (~0.64-0.66)
- 2007-2015: Gradual decline begins (0.664 → 0.549)
- 2015-2024: Decline accelerates (0.549 → 0.508)
What’s Declining?
- Electoral Democracy: -23.5% (elections less competitive)
- Liberal Democracy: -22.1% (weaker checks on power)
- Freedom of Expression: -16.6% (media pressure increasing)
- Participatory Democracy: -20.9% (reduced citizen engagement)
Why Backsliding Increases Conflict Risk:
- Eroded trust in democratic institutions
- Closing political space incentivizes extra-institutional action
- Power concentration by ethnic nationalist elites
- Weakened conflict resolution mechanisms
- Increased grievances among excluded groups
Recent Indicators of Instability:
- Republika Srpska (RS) secessionist threats (2021-2024)
- High Representative imposing laws without consent (2022-2023)
- Boycotts of state institutions by RS leadership
- Genocide denial law controversy (2021)
- Electoral system disputes and constitutional crisis (2023-2024)
Conclusion: Democratic backsliding transforms Bosnia from a stable anocracy into an unstable declining regime, significantly elevating conflict risk.
2.3 Infant Mortality (Development/State Capacity)
Bosnia: 5.3 deaths per 1,000 live births (2023)
Global Average: 27.1 deaths per 1,000 live births (2023)
Ratio: Bosnia = 19.6% of global average
Risk Level: ✅ LOW RISK (Protective Factor)
Analysis:
Infant mortality is the PITF model’s proxy for economic development and state capacity. Lower infant mortality indicates:
- Better healthcare systems
- Higher income levels
- More effective governance
- Greater state penetration to periphery
Bosnia’s Performance: Bosnia’s infant mortality rate (5.3) is exceptionally low compared to the global average (27.1), indicating:
- Upper-middle-income country development levels
- Functional healthcare system despite political dysfunction
- State capacity to deliver basic services
- Lower opportunity cost of peace (higher costs of war)
Comparative Context:
- Bosnia (5.3) is comparable to: Turkey (6.2), Mexico (10.7), Brazil (13.4)
- Far better than: Sub-Saharan Africa (50+), Afghanistan (45+)
- Approaching European levels: EU average (3.5), Serbia (4.4), Croatia (4.3)
PITF Research Finding: Countries with infant mortality below 10 per 1,000 have significantly lower conflict risk. High development creates:
- More to lose from conflict
- Greater state capacity to manage grievances
- Stronger institutions for conflict resolution
- Economic interdependence reducing mobilization
Conclusion: Bosnia’s low infant mortality is a strong protective factor against conflict onset, countering the elevated risk from its anocratic regime.
2.4 Ethnic Structure
2.4.1 Ethnic Fractionalization
Value: 0.62 (calculated from 2013 census)
Interpretation: High diversity
Risk Level: ⚠️ MODERATE RISK
Ethnic Composition (2013 Census):
- Bosniaks: 50.11%
- Serbs: 30.78%
- Croats: 15.43%
- Others: 3.68%
Fractionalization Formula: EF = 1 – Σ(group_share²)
EF = 1 – (0.5011² + 0.3078² + 0.1543²)
EF = 1 – 0.378 = 0.622
What Does This Mean? The fractionalization index (0.62) represents the probability that two randomly selected individuals are from different ethnic groups. Bosnia’s value (0.62) indicates high ethnic diversity.
Comparative Context:
- Low fractionalization (< 0.3): Japan (0.01), South Korea (0.00)
- Medium fractionalization (0.3-0.6): United States (0.49), France (0.10)
- High fractionalization (> 0.6): Bosnia (0.62), Nigeria (0.85), Kenya (0.86)
Research Findings on Fractionalization: The relationship between ethnic fractionalization and conflict is complex:
- Very high fractionalization (> 0.8): Lower risk (coordination problems)
- Moderate to high (0.5-0.7): Highest risk (enough groups to mobilize, not too many)
- Low fractionalization (< 0.3): Lower risk (demographic dominance)
Bosnia’s 0.62 places it in the moderate-high risk zone.
2.4.2 Ethnic Dominance
Largest Group: Bosniaks (50.11%)
PITF Threshold: 45-90% = Ethnic Dominance
Status: YES – Ethnic Dominance Present
Risk Level: ⚠️ ELEVATED RISK
What is Ethnic Dominance? PITF research identifies ethnic dominance (largest group 45-90% of population) as particularly conflict-prone because:
- Large enough to dominate politics
- Not large enough to govern without significant minority opposition
- Creates permanent majority-minority divide
- Minorities have sufficient size to mount armed resistance
Bosnia’s Ethnic Dominance Pattern: Bosniaks at 50.11% create a classic ethnic dominance situation:
- Slim majority (just barely over 50%)
- Strong minorities (Serbs 30.78%, Croats 15.43%)
- Geographic concentration (each group dominant in specific regions)
- Institutional power-sharing (but contested legitimacy)
Historical Context: The 1992-1995 war was fundamentally about ethnic dominance:
- Pre-war: Muslims 44%, Serbs 31%, Croats 17% (1991 census)
- Post-war: Population shifts and war deaths changed composition
- Current: Bosniaks 50.11% (slight majority)
Why This Increases Risk:
- Bosniaks can claim democratic majority but lack supermajority
- Serbs (30.78%) have enough strength to resist Bosniak dominance
- Croats (15.43%) can play kingmaker or spoiler role
- Dayton power-sharing institutionalizes ethnic divisions
- Any policy change requires ethnic consensus (veto powers)
Conclusion: Bosnia’s ethnic dominance pattern (50.11%) places it squarely in the PITF high-risk category for ethnically-driven conflict.
2.5 Ethnic Discrimination
Estimated Score: 1 (on 0-4 scale)
PITF High-Risk Threshold: ≥ 4
Risk Level: ✅ LOW RISK
Note: Direct discrimination data unavailable (MAR dataset ended 2006). Assessment based on V-Dem indicators:
- Civil Liberties: 0.811 (high – indicates low discrimination)
- Egalitarian Democracy: 0.357 (low – indicates some inequality)
Analysis: Bosnia does not appear to have active state-sponsored discrimination reaching PITF’s high-risk threshold. However, structural inequality exists:
Forms of Inequality (Not High-Level Discrimination):
- Constitutional discrimination:
- Roma, Jews, and others cannot hold presidency
- European Court of Human Rights ruled this discriminatory (Sejdić-Finci case)
- But this is passive exclusion, not active persecution
- Entity-level segregation:
- Serbs face discrimination in Federation-controlled areas
- Bosniaks face discrimination in Republika Srpska
- This is communal/local, not state-sponsored
- Education segregation:
- “Two schools under one roof” system
- Ethnic curricula separation
- But not state-imposed discrimination per se
Why This Doesn’t Reach High-Risk:
- No systematic state violence against ethnic minorities
- All three groups have constitutional protections
- No exclusion from public services
- No mass imprisonment or forced displacement
- High civil liberties score (0.811) indicates respect for rights
Conclusion: While structural ethnic inequality exists, Bosnia does NOT meet the PITF threshold for high ethnic discrimination (score ≥ 4). This is a protective factor.
2.6 Neighborhood Conflicts
Serbia: No active conflict (0)
Croatia: No active conflict (0)
Montenegro: No active conflict (0)
Total Neighbors in Conflict: 0
Risk Level: ✅ LOW RISK (Protective Factor)
Source: Uppsala Conflict Data Program (UCDP) 2020-2024
Threshold: Armed conflict = 25+ battle-related deaths per year
Analysis: Bosnia’s neighborhood is peaceful by UCDP standards. None of its immediate neighbors are experiencing armed conflicts.
Regional Context:
- Serbia: Stable, no active conflict (Kosovo tensions exist but below threshold)
- Croatia: Stable, EU member since 2013
- Montenegro: Stable, NATO member since 2017, EU candidate
Why This Matters: PITF research shows neighborhood conflicts increase civil war risk through:
- Contagion effects (ideas, tactics spread)
- Refugee flows (destabilization)
- Arms availability (spillover)
- External support for rebels (safe havens, funding)
- Regional instability (uncertainty)
Bosnia Benefits From:
- EU integration of neighbors (Croatia in EU, Serbia negotiating)
- NATO presence (peacekeeping, deterrence)
- Regional stability (no major wars in Balkans since 1999)
- International attention (High Representative, EUFOR)
Caveats: While no armed conflicts exist, tensions are present:
- Kosovo-Serbia disputes (sporadic violence but below UCDP threshold)
- RS-Serbia coordination on secession rhetoric
- Croatian interference in BiH internal politics (Croat issues)
Conclusion: Absence of neighborhood conflicts is a significant protective factor, though regional tensions remain.
3. ADDITIONAL RISK FACTORS
3.1 Post-Conflict Status
Peace Duration: 30 years (Dayton Agreement: December 14, 1995)
Risk Level: ✅ PROTECTIVE FACTOR (but weakening)
Analysis: Bosnia is a post-conflict country with 30 years of uninterrupted peace. Research on conflict recurrence shows:
Conflict Recurrence Risk Over Time:
- Years 1-5 post-conflict: VERY HIGH RISK (40-50% recurrence)
- Years 6-10 post-conflict: HIGH RISK (25-35% recurrence)
- Years 11-20 post-conflict: MODERATE RISK (15-20% recurrence)
- Years 20+ post-conflict: LOW RISK (5-10% recurrence)
Bosnia at 30 years is in the lowest-risk period for conflict recurrence.
Protective Mechanisms:
- Generational change: Adults under 30 have no war memory
- Economic integration: Trade interdependence developed
- Institutional learning: Conflict resolution mechanisms exist
- International presence: Deterrent effect
- War fatigue: Memory of costs remains
Warning Signs (Weakening Protection):
- Renewed nationalism: Ethnic rhetoric intensifying (2020-2024)
- Institutional breakdown: RS threatening secession
- International withdrawal: EUFOR reduced, OHR contested
- Economic stagnation: Emigration, unemployment, frustration
- Historical revisionism: War memory politicized
Conclusion: Long peace duration is protective, but recent trends (backsliding, secessionism) suggest this protection is weakening.
3.2 State Capacity
Rule of Law: 0.432 (V-Dem 2024)
Government Effectiveness: Estimated moderate-low
Risk Level: ⚠️ MODERATE RISK
Analysis: State capacity refers to the government’s ability to:
- Monopolize violence
- Deliver services
- Collect taxes
- Enforce laws
- Resolve disputes
Bosnia’s state capacity is weak due to:
Structural Weaknesses:
- Fragmented sovereignty: Two entities, 10 cantons, 13 constituent units
- Weak central government: Limited tax authority, no unified police
- Entity veto powers: Either entity can block state decisions
- International dependence: High Representative still active after 30 years
- Parallel institutions: Separate armies (until 2005), separate police
Rule of Law Challenges:
- Judicial independence: Political pressure on courts
- Selective enforcement: Laws enforced differently across entities
- Corruption: Widespread (0.763 on V-Dem corruption index = moderate)
- Impunity: War crimes prosecutions incomplete
Why Weak State Capacity Increases Risk:
- Cannot prevent mobilization by armed groups
- Cannot deliver services to reduce grievances
- Cannot arbitrate disputes between communities
- Cannot enforce peace agreements or court rulings
- Creates power vacuum for non-state actors
Conclusion: Weak state capacity (Rule of Law: 0.432) is a risk factor, though not reaching critical failure levels.
3.3 Economic Factors
Infant Mortality: 5.3 (protective – covered above)
Unemployment: High (estimated 15-20%, unofficial higher)
Youth Unemployment: Very high (estimated 40%+)
Emigration: Significant (brain drain, population decline)
Risk Level: ⚠️ MODERATE RISK
Analysis: While Bosnia’s development level (infant mortality 5.3) is protective, economic stagnation creates grievances:
Economic Challenges:
- High unemployment: Especially among youth
- Emigration: Best and brightest leaving
- Weak growth: GDP growth sluggish
- Corruption: Rent-seeking by elites
- Patronage economy: Ethnically-based clientelism
How Economic Grievances Increase Risk:
- Youth bulge + unemployment = recruitment pool for mobilization
- Elite corruption erodes legitimacy
- Economic stagnation increases frustration
- Patronage politics reinforces ethnic divisions
- Emigration of moderates leaves hardliners
Caveat: Economic factors are less predictive than political factors (regime type, ethnicity) in PITF model. Bosnia’s economic issues create background conditions but are not primary drivers of conflict risk.
Conclusion: Economic challenges are a contributing risk factor but not sufficient to cause conflict alone.
3.4 Geographic Factors
Terrain: Mountainous (60% mountains)
Population Distribution: Urban concentration (Sarajevo, Banja Luka, Tuzla)
Geographic Dispersion: 0.45 Gini coefficient (estimated)
Risk Level: ⚠️ MINOR RISK
Analysis: Geographic factors affect conflict through:
- Mountainous terrain provides cover for insurgents
- Weak government control in peripheral areas
- Geographic concentration of ethnic groups
Bosnia’s Geography:
- Mountainous: Favorable for guerrilla warfare (as 1992-1995 war showed)
- Ethnic concentration: Clear territorial divisions (Federation vs RS)
- Urban centers: Government control strong in cities
- Rural periphery: Weaker state presence
Historical Precedent: The 1992-1995 war demonstrated how Bosnia’s geography enables insurgency:
- Mountain strongholds (Bosnian Army in Central Bosnia)
- Territorial control (Serb-held areas vs government areas)
- Sieges (Sarajevo surrounded)
Current Situation: Geography remains permissive for conflict if it occurs but is not a primary cause.
Conclusion: Geography is a permissive factor (makes conflict feasible) but not a motivating factor (doesn’t cause conflict).
4. COMPARATIVE ANALYSIS
4.1 Comparison with Pre-War Bosnia (1991-1992)
| Factor | Pre-War (1991-1992) | Current (2024) | Risk Change |
| Regime Type | Transitional/Failing | Anocracy | Similar Risk |
| Democracy Score | N/A (transition) | 0.508 (declining) | ⚠️ Concern |
| Ethnic Composition | Muslims 44%, Serbs 31%, Croats 17% | Bosniaks 50%, Serbs 31%, Croats 15% | Similar |
| Neighborhood Conflicts | Yugoslavia collapsing, wars in Croatia | All neighbors peaceful | ✅ Better |
| Economic Conditions | Collapsing | Stagnant but stable | ✅ Better |
| International Support | Withdrawing | Present but contested | ⚠️ Weakening |
| Armed Groups | Militias forming | None currently | ✅ Better |
| Nationalist Rhetoric | Extreme | Intensifying | ⚠️ Concerning |
Key Differences:
- ✅ No neighborhood wars (unlike 1991-1992 when Croatia, Slovenia at war)
- ✅ No armed groups (unlike pre-war militia formation)
- ✅ Higher development (infrastructure, economy rebuilt)
- ✅ International deterrent (EUFOR, High Representative)
- ⚠️ Similar ethnic structure (slight Bosniak majority, strong minorities)
- ⚠️ Democratic backsliding (approaching pre-war instability)
- ⚠️ Nationalist rhetoric rising (secession threats, ethnic mobilization)
Conclusion: Bosnia today is better than 1991-1992 in key respects (no neighborhood wars, no militias, international presence) but similar in concerning ways (ethnic structure, weak institutions, nationalist rhetoric).
4.2 Comparison with Other Post-Conflict Balkan Countries
| Country | Years Since Conflict | Democracy Score | Ethnic Frac. | Current Status |
| Bosnia | 30 (1995) | 0.508 (declining) | 0.62 | Anocracy, backsliding |
| Kosovo | 26 (1999) | 0.52 | 0.51 | Anocracy, tensions |
| North Macedonia | 23 (2001) | 0.62 | 0.68 | Weak democracy |
| Croatia | 30 (1995) | 0.73 | 0.37 | Democracy, EU member |
| Serbia | 30 (1995) | 0.60 | 0.41 | Weak democracy |
Key Insights:
- Bosnia most similar to Kosovo (both anocracies, ethnic tensions)
- Croatia successfully transitioned to stable democracy
- Bosnia lagging behind regional democratic progress
- Highest ethnic fractionalization among group (0.62)
Conclusion: Bosnia is an outlier in negative direction among post-Yugoslav states, with weakest democratic performance and highest ethnic tensions.
4.3 Global Comparison: Anocracies at Risk
Countries with Similar Profiles to Bosnia:
- Lebanon: Anocracy (0.52), ethnic/religious divisions, weak state
- Iraq: Anocracy (0.43), ethnic/sectarian divisions, post-conflict
- Myanmar: Anocracy (0.36), ethnic conflicts, military role
- Mali: Anocracy (0.44), ethnic divisions, Sahel instability
Common Features:
- Anocratic regimes (0.3-0.6 democracy range)
- Ethnic or religious divisions
- Weak central authority
- Post-conflict or fragile peace
- International intervention history
Outcomes:
- Lebanon: Ongoing political crisis, economic collapse
- Iraq: Periodic violence, instability persists
- Myanmar: Civil war resumed (2021-present)
- Mali: Coups, renewed conflict (2020-present)
Bosnia’s Advantage:
- European location (geopolitical importance)
- No active insurgency (unlike Myanmar, Mali)
- Stronger international presence
- Higher development level
Bosnia’s Disadvantage:
- Democratic backsliding accelerating
- Secessionist threats growing
- International will weakening
Conclusion: Bosnia shares risk profile with several countries that experienced conflict recurrence. Geographic location and international attention are key protective factors.
5. SCENARIO ANALYSIS
5.1 Baseline Scenario (Most Likely): “Muddling Through” – 60% Probability
Scenario: Bosnia continues current trajectory of low-intensity instability without armed conflict.
Characteristics:
- Democratic backsliding continues gradually
- Republika Srpska threatens but does not secede
- Nationalist rhetoric intensifies but without mobilization
- International community maintains minimal presence
- Economic stagnation persists, emigration continues
- Ethnic tensions remain high but managed
Indicators This Scenario is Occurring:
- ✅ RS rhetoric exceeds action (pattern since 2006)
- ✅ International intervention prevents escalation
- ✅ Economic costs of conflict remain prohibitive
- ✅ No armed groups forming
- ✅ Youth emigrating rather than mobilizing
Duration: 5-10 years of continued instability
Risk Level: Low-level crisis without armed conflict
Conclusion: This is the most likely scenario based on 30-year pattern of crisis without escalation.
5.2 Escalation Scenario (Moderate Risk): “Constitutional Crisis” – 25% Probability
Scenario: Republika Srpska formally declares independence, triggering constitutional crisis but not necessarily armed conflict.
Trigger Events (Any Could Catalyze):
- RS referendum on secession (attempted 2016, threatened 2021-2024)
- High Representative imposes major reforms without consent
- International community withdraws presence (EUFOR, OHR)
- Economic crisis (regional/global shock)
- External support for secession (Russia, Serbia)
Sequence of Events:
- RS declares independence or holds referendum
- Federation and international community reject
- Institutional paralysis (all state functions cease)
- Economic disruption (trade, banking, services)
- Population polarization and mobilization
Potential Outcomes:
- Non-violent partition (negotiated, Cyprus model) – 40% of this scenario
- Low-intensity conflict (blockades, clashes, no full war) – 40% of this scenario
- Armed conflict escalation (see Scenario 5.3) – 20% of this scenario
Prevention Measures:
- EU/US clear deterrence (sanctions, intervention threats)
- Serbia refuses support for RS secession
- Economic incentives for maintaining state
- Negotiated reforms that address RS grievances
Conclusion: Constitutional crisis is plausible (25% probability) but does not automatically lead to armed conflict.
5.3 Worst-Case Scenario (Low Risk): “Armed Conflict Recurrence” – 10% Probability
Scenario: Armed conflict resumes, though unlikely to reach 1992-1995 scale.
Necessary Pre-Conditions (ALL Required):
- ✅ RS declares independence or attempts secession
- ✅ Federation attempts to prevent secession by force
- ✅ International community fails to intervene early
- ✅ Armed groups form (paramilitaries, militias)
- ✅ External support for one or both sides
Escalation Pathway:
- Constitutional crisis (RS declares independence)
- Economic blockades (entity borders close)
- Local clashes (border areas, mixed towns)
- Paramilitary formation (veterans mobilize)
- External intervention (Serbia, Croatia involvement)
- International failure to stop early escalation
- Armed conflict spreads
Conflict Characteristics (If Occurs):
- Lower intensity than 1992-1995 (no artillery, no siege warfare)
- Shorter duration (international intervention faster)
- Limited geography (entity borders, mixed areas)
- Fewer casualties (smaller mobilization, no systematic ethnic cleansing)
- Hybrid warfare (information, economic, political + limited violence)
Why This Scenario is LOW PROBABILITY (10%):
- Memory of war costs still strong after 30 years
- No armed groups currently exist (unlike 1991-1992)
- International deterrent credible (EUFOR, NATO)
- Economic costs prohibitive for all sides
- Regional stability (no neighborhood wars to provide support)
- Serbia unlikely to support militarily (EU candidacy at stake)
- Youth emigration reduces potential combatants
What Would Make This More Likely:
- Russian support for RS independence (geopolitical manipulation)
- International distraction (major war elsewhere, US/EU inattention)
- Economic collapse (desperation reduces cost calculation)
- Generational change (war memory fades, nationalist socialization)
Conclusion: Armed conflict is possible but unlikely (10% probability). Multiple protective factors must fail simultaneously.
5.4 Best-Case Scenario (Low Probability): “Democratic Consolidation” – 5% Probability
Scenario: Bosnia reverses democratic backsliding and consolidates as stable democracy.
Requirements (Highly Unlikely):
- Electoral breakthrough by non-nationalist parties
- Constitutional reform addressing structural problems
- EU membership path accelerates (clear timeline)
- Economic growth reduces emigration, increases opportunity
- Generational change reduces ethnic voting
Why This is UNLIKELY (5%):
- Ethnic voting patterns deeply entrenched (30+ years)
- Constitutional reform requires ethnic consensus (currently impossible)
- EU membership blocked by governance issues
- Economic transformation not on horizon
- Non-nationalist parties consistently lose elections
Conclusion: Democratic consolidation is highly improbable in short-to-medium term (5-10 years).
6. PITF MODEL RISK SCORE CALCULATION
6.1 Weighted Risk Score
Based on PITF research, we assign weights to key variables:
| Variable | Value | Weight | Risk Contribution |
| Regime Type (Anocracy) | Yes | 40% | HIGH |
| Democratic Backsliding | -23% | 20% | HIGH |
| Infant Mortality | 5.3 | 15% | LOW (protective) |
| Ethnic Dominance | 50.11% | 10% | MODERATE |
| Ethnic Fractionalization | 0.62 | 10% | MODERATE |
| Neighborhood Conflicts | 0 | 5% | LOW (protective) |
Aggregate Risk Assessment:
- HIGH RISK factors: 60% of weighted score (regime + backsliding)
- MODERATE RISK factors: 20% of weighted score (ethnicity)
- PROTECTIVE factors: 20% of weighted score (development + neighbors)
Overall Risk Level: MODERATE TO ELEVATED
6.2 Risk Level Classification
Based on PITF thresholds and our analysis:
Risk Categories:
- VERY HIGH (70-100%): Multiple high-risk factors, imminent threat
- HIGH (50-70%): Major risk factors present, elevated probability
- MODERATE (30-50%): Significant risks but protective factors present
- LOW (10-30%): Few risk factors, stable conditions
- VERY LOW (0-10%): No significant risk factors
Bosnia’s Classification: MODERATE RISK (35-45% range)
Justification:
- Anocracy status + backsliding trend = baseline HIGH RISK
- But: LOW infant mortality + NO neighborhood conflicts = significant mitigation
- But: Ethnic structure + weak state = persistent vulnerability
- Net: MODERATE risk, trending upward if backsliding continues
7. KEY FINDINGS AND CONCLUSIONS
7.1 Summary of Risk Assessment
Bosnia and Herzegovina faces MODERATE TO ELEVATED risk of political instability and potential armed conflict over the next 5-10 years.
Primary Risk Drivers:
- ✅ Anocratic regime (Electoral Democracy: 0.508) – single greatest risk factor
- ✅ Democratic backsliding (-23% since 2003) – accelerating trend
- ✅ Ethnic dominance + fractionalization – structural tension
- ✅ Weak state capacity (Rule of Law: 0.432) – limited conflict prevention
Primary Protective Factors:
- ✅ High development (Infant Mortality: 5.3) – high cost of conflict
- ✅ No neighborhood conflicts – no regional contagion
- ✅ 30 years of peace – war memory, institutional learning
- ✅ International presence – deterrent effect
Net Assessment: Risk factors outweigh but do not overwhelm protective factors. Bosnia is in a precarious equilibrium that could be destabilized by trigger events but is unlikely to collapse spontaneously.
7.2 Comparison to PITF Baseline
PITF High-Risk Profile:
- Anocracy: ✅ YES (0.508)
- High infant mortality (> 50): ❌ NO (5.3)
- Ethnic discrimination (≥ 4): ❌ NO (estimated 1)
- Neighborhood conflicts: ❌ NO (0)
Bosnia’s PITF Score: 1 out of 4 high-risk factors
PITF Research Shows:
- 0 factors: 1-2% conflict probability
- 1 factor: 5-10% conflict probability
- 2 factors: 15-25% conflict probability
- 3-4 factors: 40-60% conflict probability
Bosnia’s Position: 1 factor (anocracy) = 5-10% baseline risk
But:
- Democratic backsliding not in original PITF model → adds risk
- Ethnic dominance present → adds risk
- Post-conflict status → complicating factor
Adjusted Estimate: 15-20% conflict risk over 10 years
7.3 Critical Uncertainties
Key Questions That Determine Trajectory:
- Will democratic backsliding continue or reverse?
- If continues: Risk increases significantly (→ HIGH)
- If reverses: Risk decreases substantially (→ LOW)
- Current trend: Continuing
- Will Republika Srpska attempt secession?
- If yes: Constitutional crisis, elevated risk
- If no: Status quo instability continues
- Current likelihood: Rhetoric high, action uncertain
- Will international community maintain deterrent?
- If maintains: Protective factor remains
- If withdraws: Risk increases dramatically
- Current trend: Commitment weakening
- Will economic conditions improve or deteriorate?
- If improve: Reduces grievances, lowers risk
- If deteriorate: Increases desperation, raises risk
- Current trend: Stagnation, slow deterioration
- Will regional stability hold?
- If holds: Neighborhood protective factor remains
- If breaks: Contagion risk increases
- Current status: Stable but tensions (Kosovo-Serbia)
7.4 Most Likely Trajectory (5-10 Year Outlook)
Base Case (60% Probability): Bosnia continues on current path of gradual decline without armed conflict:
- Democratic backsliding persists slowly
- Economic stagnation continues, emigration accelerates
- Nationalist rhetoric intensifies but without violent mobilization
- International community maintains minimal presence
- Institutional dysfunction worsens but system does not collapse
This trajectory leads to:
- Chronic political instability
- Economic underdevelopment
- Population decline
- Missed EU membership opportunity
- Gradual hollowing out of state
But: Armed conflict remains unlikely as long as:
- International deterrent credible
- Economic costs prohibitive
- No armed groups forming
- Regional environment stable
Critical Inflection Points (2026-2030):
- 2026 Elections: Test of nationalist vs reformist strength
- 2027-2028: High Representative succession, EUFOR renewal decisions
- 2028-2030: EU accession timeline clarity (or abandonment)
8. POLICY RECOMMENDATIONS
8.1 For International Community
Priority 1: Halt Democratic Backsliding
- Conditionality: Tie EU accession progress to democratic reforms
- Support: Fund non-nationalist parties, civil society, independent media
- Monitoring: Increase election observation, judicial independence oversight
Priority 2: Maintain Credible Deterrent
- EUFOR: Maintain presence, do not draw down further
- High Representative: Clarify mandate, ensure succession continuity
- Sanctions: Make clear consequences for secession attempts
Priority 3: Address Economic Grievances
- Investment: Channel EU funds to job creation, especially youth employment
- Anti-corruption: Support judicial capacity, prosecute kleptocracy
- Development: Infrastructure, education, innovation support
Priority 4: Constitutional Reform (Long-term)
- Process: International facilitation of entity dialogue
- Goals: Reduce ethnic vetoes, strengthen central government
- Realism: This will take years, but process must begin
8.2 For Bosnian Political Leaders
For All Parties:
- De-escalate: Reduce nationalist rhetoric, especially secession threats
- Compromise: Accept that no ethnic group can govern alone
- Reform: Support constitutional changes that strengthen state
- Economy: Focus on development, job creation, reducing emigration
For Republika Srpska Leadership:
- Engage: Participate in state institutions rather than boycott
- Negotiate: Address grievances through dialogue not ultimatums
- Calculate: Consider costs of secession (economic, international)
For Federation Leadership:
- Accommodate: Address legitimate RS concerns about over-centralization
- Unity: Reduce Bosniak-Croat tensions within Federation
- Governance: Improve delivery of services, reduce corruption
8.3 For Regional Actors
For Serbia:
- Restrain: Do not encourage or support RS secession rhetoric
- Constructive: Use influence to promote dialogue, not obstruction
- Choice: Choose EU accession over Greater Serbia narratives
For Croatia:
- Withdraw: Stop interfering in Croat party politics in BiH
- Facilitate: Support BiH’s EU path, not ethnic particularism
For EU:
- Accelerate: Provide clearer path to membership with specific timeline
- Invest: Increase pre-accession funds tied to reforms
- Engage: High-level political attention to Balkans
9. CONCLUSION
9.1 Final Assessment
Bosnia and Herzegovina is at a critical juncture. After 30 years of peace, the country faces MODERATE TO ELEVATED risk of returning to conflict, driven primarily by its anocratic regime structure and accelerating democratic backsliding. While armed conflict remains unlikely in the short term (5 years), the trajectory is concerning.
The window for preventive action is closing. If democratic backsliding continues for another 5-10 years, Bosnia will enter a HIGH RISK category where conflict becomes significantly more probable. The current period (2025-2030) represents a critical opportunity to reverse course.
Bosnia’s fate is not predetermined. The PITF model shows that conflict is more likely in anocracies with ethnic divisions and declining democracy, but it is not inevitable. High development levels, absence of neighborhood conflicts, and international presence provide significant protection.
The choice is clear: Either Bosnia and the international community take concerted action to strengthen democratic institutions and economic development, or the country will continue its slow slide toward instability, with conflict risk increasing year by year.
9.2 Probability Estimates (5-Year Horizon, 2025-2030)
- Armed conflict onset: 10-15%
- Constitutional crisis (without armed conflict): 20-25%
- Status quo instability (muddling through): 55-60%
- Democratic consolidation: 5-10%
9.3 Probability Estimates (10-Year Horizon, 2025-2035)
- Armed conflict onset: 15-25%
- Constitutional crisis (without armed conflict): 30-35%
- Status quo instability (muddling through): 35-40%
- Democratic consolidation: 5-10%
Note: Probabilities increase over longer time horizons as protective factors erode and risk factors accumulate.
10. LIMITATIONS AND METHODOLOGICAL NOTES
10.1 Data Limitations
- Polity5 unavailable: Used V-Dem as alternative (arguably superior measure)
- MAR ended 2006: Estimated discrimination score from V-Dem proxies
- Geographic dispersion: Estimated value, not calculated from spatial data
- Economic data: Limited to infant mortality, would benefit from GDP/growth data
10.2 Model Limitations
- PITF is probabilistic: Cannot predict exact outcomes, only risk levels
- Historical basis: Model derived from 1955-2000 conflicts, may not capture new dynamics
- Non-quantified factors: Leadership quality, external shocks, black swans not modeled
- Simplification: Reality more complex than any statistical model
10.3 Alternative Approaches
Future research could incorporate:
- Collier-Hoeffler variables: GDP per capita, growth rate, commodity dependence
- Fearon-Laitin factors: Terrain roughness, non-contiguous territory, prior violence
- Network analysis: Elite coalitions, civil society strength, media environment
- Event data: Real-time monitoring of protests, violence, rhetoric
APPENDIX: DATA SOURCES
Verified Data Sources
- V-Dem Institute: Democracy indices (v15, 2024)
- https://v-dem.net/data/the-v-dem-dataset/
- World Bank: Development indicators (2023)
- Infant mortality: https://fred.stlouisfed.org/series/SPDYNIMRTINBIH
- Population: https://data.worldbank.org/indicator/SP.POP.TOTL?locations=BA
- UCDP: Armed conflict data (2024)
- https://ucdp.uu.se/downloads/
- Bosnia Census: Ethnic composition (2013)
- http://www.statistika.ba/
- https://en.wikipedia.org/wiki/2013_population_census_in_Bosnia_and_Herzegovina
- Alesina et al.: Fractionalization (2003)
- Journal of Economic Growth, 8(2), 155-194
Analytical Frameworks
- PITF Model:
- Goldstone et al. (2010). “A Global Model for Forecasting Political Instability”
- Esty et al. (1998). “State Failure Task Force Report”
- Democratic Backsliding:
- Bermeo (2016). “On Democratic Backsliding”
- Levitsky & Ziblatt (2018). “How Democracies Die”
- Ethnic Conflict:
- Fearon & Laitin (2003). “Ethnicity, Insurgency, and Civil War”
- Collier & Hoeffler (2004). “Greed and Grievance in Civil War”
END OF ANALYSIS
Report Prepared: February 5, 2026
Analyst: Conflict Prediction Study
Classification: Unclassified / Public Use